PropertyChartEngineBar3DClustered Klasse
In diesem Thema
Diese Klasse stellt ein gruppiertes 3D Balken-Diagramm dar. Hier erscheinen gleiche Werte auf der x-Achse gruppiert, was einen direkten Vergleich der Werte erlaubt.
Beispiel: Überblick über Umsatz pro Mitarbeiter und Monat oder Umsatz pro Quartal und Produktgruppe.
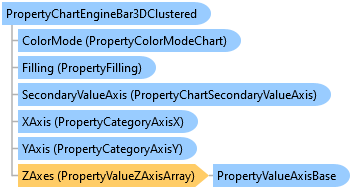
Objektmodell
Syntax
'DeklarationPublic Class PropertyChartEngineBar3DClustered Inherits PropertyChartEngineBar3DExtendedBase
public class PropertyChartEngineBar3DClustered : PropertyChartEngineBar3DExtendedBase
public ref class PropertyChartEngineBar3DClustered : public PropertyChartEngineBar3DExtendedBase
Beispiele

// add bar chart to container and assign name
SubItemChart chartBar = new SubItemChart(LlChartType.Bar3DClustered, container.SubItems);
chartBar.Name = "3D clustered bar chart";

//pass source table path
chartBar.SourceTablePath = "Employees.Orders(Employees2Orders).Order_Details(Orders2Order Details)";

//access chart engine
PropertyChartEngineBar3DClustered engineBar = (PropertyChartEngineBar3DClustered)chartBar.Definition.ChartEngine;
Vererbungshierarchie
System.Object
combit.Reporting.Dom.DomItem
combit.Reporting.Dom.PropertyChartEngineBase
combit.Reporting.Dom.PropertyChartEngineBarBase
combit.Reporting.Dom.PropertyChartEngineBar3DBase
combit.Reporting.Dom.PropertyChartEngineBar3DExtendedBase
combit.Reporting.Dom.PropertyChartEngineBar3DClustered
Anforderungen
Plattformen: Windows 10 (Version 21H2 - 22H2), Windows 11 (22H2 - 25H2), Windows Server 2016 - 2025
.NET: .NET Framework 4.8, .NET 8, .NET 9, .NET 10
Siehe auch