| Class | Description | |||||||||||
|---|---|---|---|---|---|---|---|---|---|---|---|---|
 | BackgroundShapes | Represents the background shapes. | ||||||||||
| ChartDefinitions | |||||||||||
| ChartRow | Row properties of a chart. | ||||||||||
| CollectionAdjacentDefinitions | |||||||||||
| CollectionBackgroundShapesItems | Collection of background shapes. | ||||||||||
| CollectionChartConditionalColors | A chart object can define fixed colors for axis values. This collection allows to add such assignments. | ||||||||||
| CollectionChartRows | Collection of chart rows. | ||||||||||
| CollectionCollectionVariableCollectionItems | Collection of CollectionVariableCollectionItem items. | ||||||||||
| CollectionCollectionVariableColumns | Collection of CollectionVariableColumn items. | ||||||||||
| CollectionCollectionVariables | Collection of CollectionVariables items. | ||||||||||
| CollectionColorRangeItems | Collection of ColorRangeItems. | ||||||||||
| CollectionConditionalFormatterItems | |||||||||||
| CollectionCrosstabCellBases | This collection contains the cell contents of a crosstab. You may get or set the actual content as well as display properties. | ||||||||||
| CollectionCrosstabCellGroupLabels | |||||||||||
| CollectionCrosstabCellSumLabels | |||||||||||
| CollectionCrosstabSubCells | |||||||||||
| CollectionDrillDownLinks | Collection of Drilldown-Links. | ||||||||||
| CollectionDrillDownReportParameter | |||||||||||
| CollectionEmbeddedFonts | |||||||||||
| CollectionForegroundShapesItems | Collection of foreground shapes. | ||||||||||
| CollectionFormulas | This class contains a collection of formulas. It is used to get or set the groupings in a crosstab row or column. | ||||||||||
| CollectionIconRangeItems | Collection of IconRangeItems. | ||||||||||
| CollectionLayers | This collection contains the layers of the current project. It can also be used to add new layers to the project. | ||||||||||
| CollectionManualLegend | Collection of ManualLegend items. | ||||||||||
| CollectionObjectBases | This collection contains the designer objects of the current project. It can also be used to add new objects to the project. | ||||||||||
| CollectionParagraphs | This collection contains the paragraphs of a text object. It can also be used to add new paragraphs to the object. | ||||||||||
| CollectionProjectParameters | This collection contains the project parameters (i.e. fax and mail settings etc.) of the current project. | ||||||||||
| CollectionPropertyShapeAxis | Wrapper property for the shape's y-axis. | ||||||||||
| CollectionRegions | With this class the single layout regions of the project can be set or get. | ||||||||||
| CollectionReportParameters | This collection contains the report parameters of the current project. It can also be used to add report parameters to the project. | ||||||||||
| CollectionReportParametersFromTemplates | |||||||||||
| CollectionRScriptEntryItems | |||||||||||
| CollectionRulerGuides | This collection contains the ruler guides of the current project. It can also be used to add new ruler guides to the project. | ||||||||||
| CollectionSignalItems | Collection of SignalItems for gauges. | ||||||||||
| CollectionSignalItemsBase | |||||||||||
| CollectionSignalItemsChart | Collection of SignalItems for charts. | ||||||||||
| CollectionSubItemBases | This collection is used to handle sub items in an object, e.g. a crosstab in a report container. | ||||||||||
| CollectionSubItemCoreBase | |||||||||||
| CollectionSumVariables | This collection contains the sum variables of the current project. It can also be used to add new sum variables to the project. | ||||||||||
| CollectionTableFieldBases | This collection contains the fields of a table line. It can also be used to add new fields to the line. | ||||||||||
| CollectionTableLinesBase | This collection is a base class for the table line definition collections of a table. It may not be instantiated directly. | ||||||||||
| CollectionTableLinesData | This collection contains the data lines of the current table. It can also be used to add new data lines to the table. | ||||||||||
| CollectionTableLinesFooter | This collection contains the footer lines of the current table. It can also be used to add new footer lines to the table. | ||||||||||
| CollectionTableLinesGroupFooter | This collection contains the group footer lines of the current table. It can also be used to add new group footer lines to the table. | ||||||||||
| CollectionTableLinesGroupHeader | This collection contains the group header lines of the current table. It can also be used to add new group header lines to the table. | ||||||||||
| CollectionTableLinesHeader | This collection contains the header lines of the current table. It can also be used to add new header lines to the table. | ||||||||||
| CollectionTableLinesTBase<T> | |||||||||||
| CollectionTemplates | This collection contains the templates used by the current project. It can also be used to add additional project templates. This collection contains the templates used by the current project. It can also be used to add additional project templates. | ||||||||||
| CollectionTextItems | Collection of TextItems. | ||||||||||
| CollectionUserVariables | This collection contains the user variables of the current project. It can also be used to add new user variables to the project. | ||||||||||
| CollectionVariable | Represents a collection variable. | ||||||||||
| CollectionVariableCollectionItem | An item within the collection. | ||||||||||
| CollectionVariableColumn | This class represents an actual column for a collection variable, i.e. it represents a pseudo variable that will be available in the Designer. | ||||||||||
| ColorRangeItem | This class represents a part of a DataGraphic object's bar. | ||||||||||
| ConditionalFormatterItem | Represents an object that defines the conditional formatting. | ||||||||||
| ConditionalFormatterModifiers | Determines the properties of the conditional formatting. | ||||||||||
| CoordinateLabelPlacement | This class represents the properties of the coordinate label placement and the resulting chart legend. | ||||||||||
| CoordinateLabelPlacementBase | Base class for the chart coordinate placement. | ||||||||||
| CoordinateLabelPlacementFunnel | Represents the coordinate placement for the funnel. | ||||||||||
| CrosstabCellBase | Base class for crosstab cells. | ||||||||||
| CrosstabCellBaseEnumerator | |||||||||||
| CrosstabCellCollectionInfo | |||||||||||
| CrosstabCellContent | This class represents a single content cell of a crosstab. | ||||||||||
| CrosstabCellGroupLabel | This class represents a single group label cell of a crosstab. | ||||||||||
| CrosstabCellSumLabel | This class represents a single sum label cell of a crosstab. | ||||||||||
| CrosstabSubCell | |||||||||||
| DomArrayBase<T> | |||||||||||
| DomCollectionBase<T> | |||||||||||
| DomItem | Base class for all DOM items. May not be instantiated directly. | ||||||||||
| DrillDownLink | This class represents a Drilldown-Link. | ||||||||||
| DrillDownLinkBase | |||||||||||
| DrillDownLinkForParameterizedSubreport | |||||||||||
| DrillDownReportParameterListItem | |||||||||||
| EmbeddedFont | Represents an embedded font in the project. | ||||||||||
| ExtensionObject | This class represents a user-defined object in List & Label. You only have access to the properties of the ObjectBase Class. This class represents a user-defined DesignerObject. | ||||||||||
| ForegroundShapes | Represents the foreground shapes. | ||||||||||
| GroupingContent | |||||||||||
| IconRangeItem | This class represents a range for the selection of an icon in a DataGraphic object. | ||||||||||
| Layer | This class represents a layer within the Designer. | ||||||||||
| NonFormulaAttribute | |||||||||||
| ObjectBarcode | This class represents a barcode object in List & Label. All barcodes of the LlBarcodeType Enumeration are available. | ||||||||||
| ObjectBase | This is the base class for all designer objects. If such a type is returned, it can be casted into the correct type. | ||||||||||
| ObjectChart | This object is used for analyzing and displaying different types of data. You can visualize the range of sales for example, the percentage of different sources or, of course, "simple" bar charts. A large number of different chart types are available and can be used for diverse applications. Most chart types have different sub-types.
| ||||||||||
| ObjectCheckbox | |||||||||||
| ObjectCrosstab | This class represents a crosstab object in List & Label. This object is used for the analysis and display of different types of data in multiple dimensions. E.g. sales development per year and region can be analyzed or the sales analysis per item count and customer, where you can build the sums per quarters and years. Many different layout options are available. | ||||||||||
| ObjectDataGraphic | This class represents a DataGraphic object in List & Label. | ||||||||||
| ObjectDrawing | This class represents a drawing object in List & Label. | ||||||||||
| ObjectEllipse | This class represents an ellipse object in List & Label. | ||||||||||
| ObjectGauge | Gauges can be placed inside tables or as an object. | ||||||||||
| ObjectHtml | This class represents a HTML object in List & Label. HTML-formatted texts (e.g. websites) can be displayed hereby. | ||||||||||
| ObjectInputBase | Base class for all input objects in List & Label. Input objects are used to provide form output and form input. | ||||||||||
| ObjectInputButton | This class represents a button-type input object in List & Label. | ||||||||||
| ObjectInputCheckbox | This class represents a checkbox-type input object in List & Label. | ||||||||||
| ObjectInputCombobox | This class represents a combo-type input object in List & Label. | ||||||||||
| ObjectInputEdit | This class represents a edit-type input object. User input can be made here that can be read out later. | ||||||||||
| ObjectLine | This class represents a line object in List & Label. | ||||||||||
| ObjectPdf | This class represents a PDF object in List & Label. | ||||||||||
| ObjectRectangle | This class represents a rectangle object in List & Label. | ||||||||||
| ObjectReportContainer | This class represents a report container object in List & Label. The following sub items may be included: | ||||||||||
| ObjectRtf | This class represents a RTF object in List & Label. Multiple formattings within a line can be done with this object contrary to the regular text object. So when to use the formatted text object and when to use the regular one? You should, if possible, prefer the regular text object as it contains less information and is therefore considerably faster to print. This also applies to formatted text within tables. Therefore use the formatted text object when formattings have to be done that can't be realized with the regular text object at all or only with at lot of work. | ||||||||||
| ObjectTemplate | Form templates are Bitmaps of forms that are scanned and placed in the background of your working area as a stencil so objects can be placed to fit the form. The form templates are displayed in the working area, however not printed. They also can't be further edited. | ||||||||||
| ObjectText | This class represents a text object in List & Label. User-defined text can be placed in the working area by using text objects. In addition to fixed text also placeholders (variables) like page number, date, company name that are provided by our application can be set. The variables are replaced by their respective values at print (not with the sample print!). | ||||||||||
| PageBreakOptions | Options for page break in group header lines. | ||||||||||
| Paragraph | This class represents a paragraph within a text object. | ||||||||||
| ParagraphBase | |||||||||||
| ProjectBase | Base class for all project classes. May not be instantiated directly. Instead, use one of the following derived classes: | ||||||||||
| ProjectCard | This class represents a card-type project. | ||||||||||
| ProjectIndex | This class represents a index-type project (*.idx). | ||||||||||
| ProjectLabel | This class represents a label-type project. | ||||||||||
| ProjectList | This class represents a list/report-type project. | ||||||||||
| ProjectMetadata | |||||||||||
| ProjectParameter | This class represents a project parameter used to determine fax and mail settings etc. | ||||||||||
| ProjectReverseSide | |||||||||||
| ProjectTableOfContents | This class represents a TableOfContents-type project (*.toc). | ||||||||||
| PropertyAlignment | Gets or sets alignment options for the DataGraphic bar. | ||||||||||
| PropertyAlignmentHorizontal | Determines the horizontal alignment of the text like in your word processor. Following values are allowed:
| ||||||||||
| PropertyAlphaBlendableItem | This class represents an element which support Alpha Blending, e.g. a frame or background. | ||||||||||
| PropertyAnchor | This class defines the anchor to a row. | ||||||||||
| PropertyAnimation | |||||||||||
| PropertyAnimationTrigger | |||||||||||
| PropertyAutoFill | |||||||||||
| PropertyAztecBarcodeSource | |||||||||||
| PropertyBackground | This class defines the chart background. | ||||||||||
| PropertyBackgroundShapesItem | A background shape file. | ||||||||||
| PropertyBar | Gets or sets the properties of the task bar. | ||||||||||
| PropertyBarcodeSource | Allows to set important barcode options like barcode type and content. | ||||||||||
| PropertyBookmark | Allows to configure level and text for a bookmark. | ||||||||||
| PropertyBubbleDesign | This class represents the design of a bubble in a bubble chart. | ||||||||||
| PropertyCategoryAxis | |||||||||||
| PropertyCategoryAxisBase | This class represents a category axis (x-Axis or - for 3D charts - x/y axis). | ||||||||||
| PropertyCategoryAxisFunnel | Represents the category axis of a funnel chart. | ||||||||||
| PropertyCategoryAxisPie | This class represents a category axis (x-Axis). | ||||||||||
| PropertyCategoryAxisX | Represents a x category axis. | ||||||||||
| PropertyCategoryAxisXRadar | |||||||||||
| PropertyCategoryAxisXTreeMap | |||||||||||
| PropertyCategoryAxisY | Represents a y category axis. | ||||||||||
| PropertyCategoryAxisYRadar | |||||||||||
| PropertyCategoryAxisYTreeMap | |||||||||||
| PropertyCell | Gets or sets the properties of the cell. | ||||||||||
| PropertyChartArea | Gets or sets the properties of the gantt chart area. | ||||||||||
| PropertyChartColor | This class represents a color of a diagram element that is not represented by the "conditional colors". For a bar chart, it determines the color of a bar. For a pie chart, it determines the color of one slice. | ||||||||||
| PropertyChartColorArray | Determines the color order of chart elements for which no "conditional color" is available. To choose a color, access the corresponding item directly by the index (see example). | ||||||||||
| PropertyChartConditionalColor | This class represents an entry in the collection of conditional colors (CollectionChartConditionalColors Class). Use it to assign fixed colors to certain values. | ||||||||||
| PropertyChartDefinition | This class represents all properties defining a chart object. | ||||||||||
| PropertyChartEngineAreaSimple | This class represents a simple area chart. | ||||||||||
| PropertyChartEngineAreaStacked | This class represents a stacked area chart. | ||||||||||
| PropertyChartEngineAreaStackedRelative | This class represents a relatively stacked area chart. | ||||||||||
| PropertyChartEngineBar2D | This class represents a 2D bar chart. | ||||||||||
| PropertyChartEngineBar2DBase | Base class for 2D bar charts. | ||||||||||
| PropertyChartEngineBar2DClustered | This class represents a clustered 2D bar chart. | ||||||||||
| PropertyChartEngineBar2DStacked | This class represents a stacked 2D bar chart. | ||||||||||
| PropertyChartEngineBar2DStackedRelative | This class represents a relatively stacked 2D bar chart. | ||||||||||
| PropertyChartEngineBar3D | This class represents a 3D bar chart. | ||||||||||
| PropertyChartEngineBar3DBase | Base class for 3D bar charts. | ||||||||||
| PropertyChartEngineBar3DClustered | This class represents a clustered 3D bar chart. | ||||||||||
| PropertyChartEngineBar3DExtendedBase | Base class for extended 3D charts. | ||||||||||
| PropertyChartEngineBar3DMultiRow | This class represents a multi row 3D bar chart. | ||||||||||
| PropertyChartEngineBar3DStacked | This class represents a stacked 3D bar chart. | ||||||||||
| PropertyChartEngineBar3DStackedRelative | This class represents a relatively stacked 3D bar chart. | ||||||||||
| PropertyChartEngineBarBase | Base class for bar charts. | ||||||||||
| PropertyChartEngineBase | Base class for chart engine types. | ||||||||||
| PropertyChartEngineBubbleScattered | This class represents a scattered bubble chart. | ||||||||||
| PropertyChartEngineBubbleSorted | This class represents a sorted bubble chart. | ||||||||||
| PropertyChartEngineDonut2D | This class represents a 2D donut chart. | ||||||||||
| PropertyChartEngineDonut3D | This class represents a 3D donut chart. | ||||||||||
| PropertyChartEngineFunnelBase | Base class for funnel charts. | ||||||||||
| PropertyChartEngineFunnelHorizontal | This class represents a horizontal funnel chart. | ||||||||||
| PropertyChartEngineFunnelVertical | This class represents a vertical funnel chart. | ||||||||||
| PropertyChartEngineLineAreaBubbleBase | Base class for line, area and bubble charts. | ||||||||||
| PropertyChartEngineLineMultiRow | This class represents a multi row line chart. | ||||||||||
| PropertyChartEngineLineSimple | This class represents a simple line chart. | ||||||||||
| PropertyChartEngineLineStacked | This class represents a stacked line chart. | ||||||||||
| PropertyChartEngineLineStackedRelative | This class represents a relatively stacked line chart. | ||||||||||
| PropertyChartEnginePie2D | This class represents a 2D pie chart. | ||||||||||
| PropertyChartEnginePie3D | This class represents a 3D pie chart. | ||||||||||
| PropertyChartEnginePieDonutBase | Base class for pie and donut charts. | ||||||||||
| PropertyChartEngineRadar | |||||||||||
| PropertyChartEngineRadarBase | |||||||||||
| PropertyChartEngineRadarClustered | |||||||||||
| PropertyChartEngineRadarSimple | |||||||||||
| PropertyChartEngineRadarStacked | |||||||||||
| PropertyChartEngineRadarStackedRelative | |||||||||||
| PropertyChartEngineRscript | |||||||||||
| PropertyChartEngineShapeFile | This class represents a shapefile chart. | ||||||||||
| PropertyChartEngineTreeMapBase | |||||||||||
| PropertyChartEngineTreeMapClustered | |||||||||||
| PropertyChartEngineTreeMapSingle | |||||||||||
| PropertyChartLabel | This class represents a label for a chart axis. | ||||||||||
| PropertyChartLabelCoordinate | This class represents a coordinate label or legend text. | ||||||||||
| PropertyChartLabelCoordinateOnObject | This class represents a label on a chart element, e.g. a percentage value within a bar. | ||||||||||
| PropertyChartLabelCoordinateOnObjectPie | This class represents a label on a pie segment, e.g. a percentage value. | ||||||||||
| PropertyChartLabelCoordinateOthers | This class represents the label on the "Others" pie segment. | ||||||||||
| PropertyChartLabelPie | This class represents a label for a pie segment, e.g. a percentage value. | ||||||||||
| PropertyChartSecondaryValueAxis | Determines settings for a secondary value axis. | ||||||||||
| PropertyChartSignalRanges<T> | |||||||||||
| PropertyChartTitle | This class represents the chart's title. | ||||||||||
| PropertyCheckboxDefinition | |||||||||||
| PropertyCheckboxDesign | |||||||||||
| PropertyCheckboxItemFor | |||||||||||
| PropertyCheckboxItemForResource | |||||||||||
| PropertyCodablockFBarcodeSource | |||||||||||
| PropertyColorModeChart | Determines the general colouring of the diagram. | ||||||||||
| PropertyColorRanges | Gets or sets the filling range properties for the DataGraphic bar. | ||||||||||
| PropertyColumns | This class represents the columnar layout of a container sub item. | ||||||||||
| PropertyCrosstabCells | This class gives you access to the cells of the crosstab. You may access just one cell, a whole row or column, or - by using the All Property - all cells simultaneously. | ||||||||||
| PropertyCrosstabColumnWrapping | Gets or sets the wrapping behavior of a cross tab in horizontal direction. | ||||||||||
| PropertyCrosstabDefinition | This class provides further properties for setting multiple values of the crosstab. With this class the complete content of the crosstab can be defined. | ||||||||||
| PropertyCrosstabDefinitionBase | |||||||||||
| PropertyCrosstabDimension | Gets or sets the content of a crosstab in one dimension (columns vs. rows). You may specify the groupings to use as well as the GroupLabel or SumLabel to be used. | ||||||||||
| PropertyCrosstabPageBreakPreferences | Gets or sets the wrapping behavior of a crosstab. | ||||||||||
| PropertyCrosstabShadowPages | Gets or sets the behavior of so called "shadow pages" i.e. pages that are triggered by a crosstab wrap in horizontal direction. | ||||||||||
| PropertyCrosstabSummary | Gets or sets the properties for a crosstab grouping summary, i.e. the sum for a column or row. | ||||||||||
| PropertyCrosstabWrapping | Gets or sets the wrapping behavior of a crosstab in one dimension. | ||||||||||
| PropertyDataGraphicBar | Gets or sets the properties of the bar DataGraphic. | ||||||||||
| PropertyDataGraphicData | Gets or sets the value to visualize. | ||||||||||
| PropertyDataGraphicDefinition | Gets or sets the definition of the DataGraphic object. | ||||||||||
| PropertyDataGraphicDisplay | Gets or sets the display properties of the visualized value. | ||||||||||
| PropertyDataGraphicIcon | Gets or sets the properties of the icon DataGraphic. | ||||||||||
| PropertyDataLinesOptions | This class is used to set additional options for the data lines of a table object. | ||||||||||
| PropertyDataLinesOptionsStaticTable | This class is used to set additional options for the data lines of a table object of type "free content". | ||||||||||
| PropertyDatamatrixBarcodeSource | |||||||||||
| PropertyDateTimeFormat | Offers properties to define a date/time format. This class is used by the OutputFormatter classes. | ||||||||||
| PropertyDefaultColumns | This class represents the columnar layout of a report container. | ||||||||||
| PropertyDefaultValues | Represents the default value for a report parameter. | ||||||||||
| PropertyDesignQRBarcodeSource | |||||||||||
| PropertyDesignSchemeColors | Indexed access to the individual color values can be used to determine the colors with the help of the string RGB(r, g, b). | ||||||||||
| PropertyDevice | Printer settings. | ||||||||||
| PropertyDisplay | This class represents the display options of a drawing object. | ||||||||||
| PropertyDisplayRange | Describes the percentage range of the available area in which this element is displayed. | ||||||||||
| PropertyDistance | Represents distance properties for a scale. | ||||||||||
| PropertyDrawing | |||||||||||
| PropertyDrawingContents | Gets or sets the source for a drawing. | ||||||||||
| PropertyDrawingFileInfo | Gets or sets file path and name of a drawing file. | ||||||||||
| PropertyEPCBarcodeSource | |||||||||||
| PropertyFieldWrapping | Gets or sets the wrapping behavior of a table field. | ||||||||||
| PropertyFilling | Gets or sets the properties of a filling e.g. a background, a rectangle filling etc. | ||||||||||
| PropertyFillingExt | Gets or sets the properties of a filling and a possible gradient fill. | ||||||||||
| PropertyFillingWithBitmap | Gets or sets the properties of a filling with a possible gradient fill or an image based fill. | ||||||||||
| PropertyFixedBarOptions | Offers properties to set the bar width and alignment for barcodes supporting these settings. | ||||||||||
| PropertyFixedSize | Gets or sets the behavior of a table object on the last page. The object may have a fixed size (i.e. stretch to the bottom of the object anyway) and the separators can be extended to the bottom as well. | ||||||||||
| PropertyFont | Allows to set a font for an object. | ||||||||||
| PropertyFontExt | Allows to set a font for an object. | ||||||||||
| PropertyFooterLinesOptions | This class is used to set additional options for the footer lines of a table object. | ||||||||||
| PropertyForegroundShapesItem | A foreground shape file. | ||||||||||
| PropertyFrame | Represents the frame properties of an object. | ||||||||||
| PropertyFrameExt | Represents the frame properties of an object. | ||||||||||
| PropertyFrameLine | Represents a single line of an object's frame. | ||||||||||
| PropertyFrameLineBase | Represents a single line of an object's frame. | ||||||||||
| PropertyFrameWithoutSpacing | Represents a single line of an object's frame. | ||||||||||
| PropertyGanttChartDefinition | Gets or sets the definition of the gantt chart subitem. | ||||||||||
| PropertyGanttShadowPages | This class represents the wrapping properties of a Gantt chart object. | ||||||||||
| PropertyGaugeDefinition | Gets or sets the definition of the gauge object. | ||||||||||
| PropertyGaugeSignalRanges<T> | |||||||||||
| PropertyGradient | Defines a lightness gradient for a pie chart surface. | ||||||||||
| PropertyGrid | Specifies whether a grid net should be placed in the background of the workspace or not. You can set the distances between the grid lines. With the Snap property you ensure that objects are not freely inserted or moved on the workspace but only along the (possibly invisible) grid lines. | ||||||||||
| PropertyGridLines | This class represents the grid lines of a chart. | ||||||||||
| PropertyGridLineStyle | |||||||||||
| PropertyGridMode | |||||||||||
| PropertyGroupFooterLinesOptions | This class is used to set additional options for the group footer lines of a table object. | ||||||||||
| PropertyGroupHeaderLinesOptions | This class is used to set additional options for the group header lines of a table object. | ||||||||||
| PropertyHighlightRange | Gets or sets the properties for the highlight range (i.e. a range that is highlighted in the gantt chart). | ||||||||||
| PropertyIconRanges | Gets or sets the icon range properties for the DataGraphic object. | ||||||||||
| PropertyIndexCell | Gets or sets the properties of the index cell. | ||||||||||
| PropertyInnerInterval | Gets or sets the properties of the inner gantt chart interval and allows to set the scale. | ||||||||||
| PropertyInputButtonActionBase | Base class for all action buttons. May not be instantiated directly. | ||||||||||
| PropertyInputButtonActionHttpPost | Gets or sets the behavior of a HTTP post button. This button can be used to HTTP post information from a form to a server. | ||||||||||
| PropertyInputButtonActionLink | Gets or sets the behavior of a link button. This button can be used to start a browser or application. | ||||||||||
| PropertyInputButtonActionPdfSig | |||||||||||
| PropertyInputButtonActionSaveAs | Gets or sets the behavior of a "save as" button. This button can be used to save the preview file e.g. to PDF. | ||||||||||
| PropertyInputButtonActionSendTo | Gets or sets the behavior of a "send to" button. This button can be used to send the preview file e.g. via MAPI. | ||||||||||
| PropertyInputEditVerification | Allows to specify verification rules for an input control. | ||||||||||
| PropertyKeepTogether | |||||||||||
| PropertyLabelCell | Gets or sets the properties of the label cell. | ||||||||||
| PropertyLabels | Represents the labels on a gauge. | ||||||||||
| PropertyLayout | Defines the layout of the label-sheet or card. | ||||||||||
| PropertyLayoutBase | Base class for all layout classes. May not be instantiated directly. | ||||||||||
| PropertyLegendItem | Represents an item in a chart legend. | ||||||||||
| PropertyLine | Allows to set the properties of a line. | ||||||||||
| PropertyLineOptions | Allows to set options for the different table line types (data, header, footer,...). | ||||||||||
| PropertyLineOptionsStaticTable | With this class the properties of a data line within a table can be set. | ||||||||||
| PropertyLineSmoothing | Defines the smoothing of the line. | ||||||||||
| PropertyMatchDevicePixel | |||||||||||
| PropertyMaxEntryCount | |||||||||||
| PropertyMaxicodeBarcodeSource | |||||||||||
| PropertyMaxicodeUPSBarcodeSource | |||||||||||
| PropertyMicroPDF417BarcodeSource | |||||||||||
| PropertyOuterInterval | Gets or sets the properties of the outer gantt chart interval and allows to set the scale. | ||||||||||
| PropertyOutputFormatterBase | Base class for all output formatter classes. May not be instantiated directly. | ||||||||||
| PropertyOutputFormatterCurrency | This class can be used to define the format of a text. It allows to format the contents as currency. | ||||||||||
| PropertyOutputFormatterDate | This class can be used to define the format of a text. It allows to format the contents as date. | ||||||||||
| PropertyOutputFormatterDateTime | This class can be used to define the format of a text. It allows to format the contents as date and time. | ||||||||||
| PropertyOutputFormatterDateTimeDiff | With this property the formattings for the display of text can be set. This class is used for the display in the form of a time difference. | ||||||||||
| PropertyOutputFormatterDegree | This class can be used to define the format of a text. It allows to format the contents as degree value. | ||||||||||
| PropertyOutputFormatterDouble | This class can be used to define the format of a text. It allows to format the contents as number. | ||||||||||
| PropertyOutputFormatterDoubleBase | |||||||||||
| PropertyOutputFormatterNone | |||||||||||
| PropertyOutputFormatterPercentage | This class can be used to define the format of a text. It allows to format the contents as percentage. | ||||||||||
| PropertyOutputFormatterTime | This class can be used to define the format of a text. It allows to format the contents as time. | ||||||||||
| PropertyPaper | Gets or sets the paper properties (e.g. extent, printable area etc.). | ||||||||||
| PropertyParagraphWrapping | Allows to define the wrap behavior of a text paragraph. | ||||||||||
| PropertyPDF417BarcodeSource | |||||||||||
| PropertyPdfDefinition | Represents the definition of the PDF object. | ||||||||||
| PropertyPdfSource | Represents the PDF source. | ||||||||||
| PropertyPointer | This class represents the pointer type of a gauge. | ||||||||||
| PropertyPosition | Represents the position of a TextItem. | ||||||||||
| PropertyPostalData | This property represents the PREMIUMADRESS-ID of the Premiumadress barcode type. | ||||||||||
| PropertyPostProcessing | Gets the data post processing mode for the current row. | ||||||||||
| PropertyPremiumAddressBarcodeSource | |||||||||||
| PropertyPremiumAdress | Represents the Premiumadress barcode. | ||||||||||
| PropertyPrintableArea | Gets or sets the extent of the printable area. | ||||||||||
| PropertyQRBarcodeSource | |||||||||||
| PropertyRange | This class allows to define value ranges for a chart's value axis. | ||||||||||
| PropertyReadOnlySize | Gets the size of an object. | ||||||||||
| PropertyRect | Allows to set the coordinates of an object. | ||||||||||
| PropertyRectangleFrame | Gets or sets the properties of a rectangle frame. | ||||||||||
| PropertyRectBase | Base class for rectangles. | ||||||||||
| PropertyRelativeRadiusOfParallelPart | Gets or sets the properties of the funnel end slice. | ||||||||||
| PropertyReportSection | Represents a section of a report (e.g. table of contents, index, reverse side). | ||||||||||
| PropertyReportSectionReverseSide | Represents a reverse side section of a report. | ||||||||||
| PropertyReportSections | Represents the additional sections of the report. | ||||||||||
| PropertyRepresentationCodes | If you plan to use List & Label projects for SBCS codepages like 1257 (Baltic rim), 1251 (Cyrillic/Slavic), 1253 (Greek), 1254 (Latin 5: Turkish), 1250 (Latin 2), make sure to set the representation codes to characters not used in the codepage. Also, when working with DBCS characters, none of the representation codes may be in the lead byte range of the target language. | ||||||||||
| PropertyReservedSpace | Gets or sets the space between the border and the contents of an object. | ||||||||||
| PropertyRScriptCommonVarExport | |||||||||||
| PropertyRScriptData | |||||||||||
| PropertyRScriptOutputExtension | |||||||||||
| PropertyRtfSource | Determines the content source for a RTF object. | ||||||||||
| PropertyRulerGuides | Contains enumerations for horizontal and vertical ruler guides. | ||||||||||
| PropertyScaleLabels | Gets or sets the properties of the scale labels. | ||||||||||
| PropertyScaleLimits | Gets or sets the properties of the scale limits. | ||||||||||
| PropertyScaleValueDistance | Gets or sets the distance of the scale values. | ||||||||||
| PropertySettings | Allows to change project specific settings e.g. the default font used for all new objects. | ||||||||||
| PropertyShadow | Gets or sets the properties of a shadow attached to an object. | ||||||||||
| PropertyShadowPagesBase | This base class represents the wrapping properties of shadow page enabled objects (e.g. Gantt, Crosstab). | ||||||||||
| PropertyShapeBackground | Represents the shape background. | ||||||||||
| PropertyShapeBoundarySelection | Represents the boundary selection properties of the shape chart. | ||||||||||
| PropertyShapeDefinition | Represents the shape definition. | ||||||||||
| PropertyShapeDefinitionData | Represents the data in the shape chart. | ||||||||||
| PropertyShapeItemBase | Base class for shape items. | ||||||||||
| PropertyShapeXAxis | Gets the X-Axis of the shape chart. | ||||||||||
| PropertyShapeYAxis | Gets the Y-Axis of the shape chart. | ||||||||||
| PropertySignalRanges<T> | |||||||||||
| PropertySize | Gets or sets the size or count of (an) object(s). | ||||||||||
| PropertySortOrderAscending | |||||||||||
| PropertySortOrders | Gets or sets the sort orders that can be set interactively in the preview. | ||||||||||
| PropertySource | Represents the data source for a report parameter's values. | ||||||||||
| PropertyStartValue | Gets or sets the scale's start value. | ||||||||||
| PropertyTableArea | Gets or sets the properties of the gantt table area. | ||||||||||
| PropertyTableFieldAztecBarcodeSource | |||||||||||
| PropertyTableFieldBarCodeSource | |||||||||||
| PropertyTableFieldCodablockFBarcodeSource | |||||||||||
| PropertyTableFieldDatamatrixBarcodeSource | |||||||||||
| PropertyTableFieldDesignQRBarcodeSource | |||||||||||
| PropertyTableFieldEPCBarcodeSource | |||||||||||
| PropertyTableFieldMaxicodeBarcodeSource | |||||||||||
| PropertyTableFieldMaxicodeUPSBarcodeSource | |||||||||||
| PropertyTableFieldMicroPDF417BarcodeSource | |||||||||||
| PropertyTableFieldPDF417BarcodeSource | |||||||||||
| PropertyTableFieldPremiumAddressBarcodeSource | |||||||||||
| PropertyTableFieldQRBarcodeSource | |||||||||||
| PropertyTableLines | Contains enumerations for the different line definitions in a table. | ||||||||||
| PropertyTableLinesStaticTable | This class represents a line definition in a free content table. | ||||||||||
| PropertyTaskRows | Gets or sets the properties of the task rows. | ||||||||||
| PropertyTextItemBackground | Gets or sets the background for the text item. | ||||||||||
| PropertyTextQuoteCodes | Specifies the embracing characters for text. | ||||||||||
| PropertyTickmarks | This class represents the tick mark options of a chart axis. | ||||||||||
| PropertyTickmarksExt | Gets or sets the tickmark properties. | ||||||||||
| PropertyTitleRow | Gets or sets the properties of the title row. | ||||||||||
| PropertyUserDefinedDesignScheme | Used to query or determine the user-defined design scheme. | ||||||||||
| PropertyValueAxis | This class represents the value axis (y-axis for 2D, z-axis for 3D diagrams) of a chart. | ||||||||||
| PropertyValueAxisArray | This class offers access to the value axes (y-axes for 2D, z-axes for 3D diagrams) of a chart. The primary axis has the index 0. | ||||||||||
| PropertyValueAxisArrayLine | |||||||||||
| PropertyValueAxisArrayRadar | |||||||||||
| PropertyValueAxisArrayTreeMap | |||||||||||
| PropertyValueAxisBase | This base class represents a value axis. | ||||||||||
| PropertyValueAxisBaseMinimal | |||||||||||
| PropertyValueAxisBubbleChartScattered | This class represents the value axis of a scattered bubble chart. | ||||||||||
| PropertyValueAxisBubbleChartSorted | This class represents the value axis of a sorted bubble chart. | ||||||||||
| PropertyValueAxisFunnel | This class represents the value axis of a funnel chart. | ||||||||||
| PropertyValueAxisPie2D | This class represents the value axis of a 2D pie chart. | ||||||||||
| PropertyValueAxisPie3D | This class represents the value axis of a 3D pie chart. | ||||||||||
| PropertyValueAxisRadar | |||||||||||
| PropertyValueAxisTreeMap | |||||||||||
| PropertyValueAxisWithPostProcessing | |||||||||||
| PropertyValueAxisWithPostProcessingAndVisual | |||||||||||
| PropertyValueZAxisArray | |||||||||||
| PropertyVisual | |||||||||||
| PropertyWrapping | |||||||||||
| PropertyXhtmlAnimation | |||||||||||
| Region | This class represents a layout region in the List & Label Designer. | ||||||||||
| ReportParameter | This class represents a report parameter. | ||||||||||
| RScriptDataEntryItem | |||||||||||
| RulerGuide | Contains all properties of a ruler guide. | ||||||||||
| SeparatedStringCollection | A string collection that can be serialized to a separated string. | ||||||||||
| SettableDomArray<T> | |||||||||||
| SignalItem | Gets or sets the properties of a colored range on the gauge scale. | ||||||||||
| SignalItemBase | |||||||||||
| SignalItemChart | |||||||||||
| SubItemBase | Base class for all report container item types. May not be instantiated directly. | ||||||||||
| SubItemChart | This class represents a chart item. | ||||||||||
| SubItemCore | |||||||||||
| SubItemCrosstab | This class represents a crosstab item. | ||||||||||
| SubItemGanttChart | This class represents a gantt chart item. | ||||||||||
| SubItemStaticTable | This class represents a table item of type "free content". | ||||||||||
| SubItemSubReport | |||||||||||
| SubItemTable | This class represents a table item. | ||||||||||
| SubItemTableBase | This class is the base class of all table items. | ||||||||||
| SumVariable | This class represents a sum variable. | ||||||||||
| TableField | |||||||||||
| TableFieldBarcode | This class represents a barcode table field. | ||||||||||
| TableFieldBase | Base class for all table field types. May not be instantiated directly. | ||||||||||
| TableFieldChart | This class represents a chart object in List & Label within a table row. | ||||||||||
| TableFieldCheckbox | |||||||||||
| TableFieldDataGraphic | This class represents a DataGraphic table field. | ||||||||||
| TableFieldDrawing | This class represents a drawing table field. | ||||||||||
| TableFieldExtensionObject | Represents an instance of the Designer object, which has been inserted into a table column by an user. Besides the height, no other properties can be set. This class represents a user-defined DesignerObject. | ||||||||||
| TableFieldGauge | This class represents a gauge table field. | ||||||||||
| TableFieldHtml | This class represents a HTML table field. | ||||||||||
| TableFieldPdf | This class represents a PDF table field. | ||||||||||
| TableFieldRtf | This class represents a RTF table field. | ||||||||||
| TableFieldTable | |||||||||||
| TableFieldText | This class represents a text table field. | ||||||||||
| TableInputFieldBase | |||||||||||
| TableInputFieldButton | |||||||||||
| TableInputFieldCheckbox | |||||||||||
| TableInputFieldComboBox | |||||||||||
| TableInputFieldEdit | |||||||||||
| TableLineBase | Base class for all table line types. May not be instantiated directly. | ||||||||||
| TableLineData | This class represents a data line in a table. | ||||||||||
| TableLineFooter | This class represents a footer line in a table. | ||||||||||
| TableLineGroupBase | |||||||||||
| TableLineGroupFooter | This class represents a group footer line in a table. | ||||||||||
| TableLineGroupHeader | This class represents a group header line in a table. | ||||||||||
| TableLineHeader | This class represents a header line in a table. | ||||||||||
| Template | This class represents a template, i.e. a include file for a project. | ||||||||||
| TextItem | Represents a single text item on a gauge scale. | ||||||||||
| UserVariable | This class represents a user variable. |
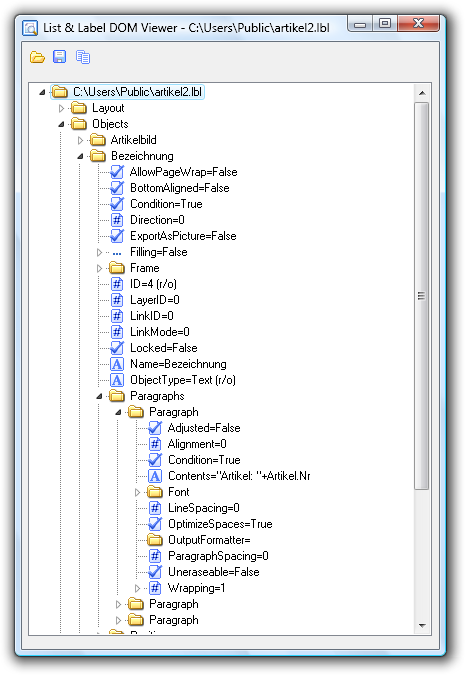
To create project files dynamically at runtime or to edit project files via code, you can work with the List & Label DOM functions. Comfortable class wrappers are available. Advice for their usage can be found in this help.
To create a new project, you need the Open Method of the ProjectBase Class. To edit existing projects, use the GetFromParent Method.
Important note: It is also possible when opening a project with DOM to specify that any errors should be ignored when editing. So it is possible to edit the project file even without accessing the original data source.
But changes to the (data-) structure of the project, which are based on formulas or variables/fields of the data source, can not be considered and implemented. Because without data source then the formulas in the project are treated like placeholders, and thus then the section with the used variables (see LlGetUsedIdentifiers()) cannot be written correctly, if you append e.g. in a table further columns. The content of this section is then left unchanged when saving. The same applies in case a new table is inserted in a report container, which was not used before. In addition, the DOM types of individual elements in the project file cannot be correctly identified in this case.
Only when the data source in the ListLabel object used is also known can the project be processed with DOM completely and without restrictions. Only then can any formulas etc. be interpreted to use the correct DOM type.
| Interface | Description | |
|---|---|---|
 | IDomCollectionBase | |
| IDomItemWithConditionalFormatter | |
| IDomItemWithOutputFormatter |
| Enumeration | Description | |
|---|---|---|
 | InputObjectType | |
| LlDomAccessMode | When opening a project you must choose whether to open the file with read/write access or read only. If you want to make changes to the project and save them, make sure to choose ReadWrite access mode. |
| LlDomControlType | Determines the control type for the report parameter's UI. |
| LlDomCurrentObjectLevel | |
| LlDomFileMode | When opening a project you must choose whether the file should be opened if existing, created always etc. This can be specified by using one of the enumeration values. |
| LlDomGaugeType | Defines the type of the gauge. |
| LlDomHorizontalLinkType | This enumeration contains the diverse available link types for a horizontal object linkage. |
| LlDomHorizontalSizeAdaptionType | This enumeration contains the diverse available size adaption types for a horizontal object linkage. |
| LlDomSettings | This enumeration controls the behavior when opening a List & Label project file via DOM. |
| LlDomSourceContentsType | Determines the type of the report parameter. |
| LlDomSourceType | Determines the source type of the report parameter. |
| LlDomVerticalLinkType | This enumeration contains the diverse available link types for a vertical object linkage. |
| LlDomVerticalSizeAdaptionType | This enumeration contains the diverse available size adaption types for a vertical object linkage. |
| LlFindAndReplaceOptions | Specifies the options to use for a find or replace operation. |
| LlReplaceAction | Specifies the action for a replace operation and will be used in event ReplaceHit. |
| ProjectFormat | |
| ReportParameterValueType |