ObjectChart Class
In This Topic
This object is used for analyzing and displaying different types of data. You can visualize the range of sales for example, the percentage of different sources or, of course, "simple" bar charts. A large number of different chart types are available and can be used for diverse applications. Most chart types have different sub-types.
In general, a distinction is made between three and two axis charts. Three axis charts have three data axes and can be used to visualize the sales range per month and employee, for example. A two axis chart has only two data axes and shows e.g. the sales range for the whole company over a number of months.
A selection of options:
- Many properties can be defined by formula. Thus the label or label size can be dependent on the content.
- The background of a chart can be filled with a color gradient and / or zebra pattern.
- The boundary around a chart can also have rounded corners and a shadow.
- Separating lines between the pie segments of a pie chart can be activated and deactivated.
- The filling of the pie segments of a pie chart can be given a color gradient (3D effect).
- The labeling of a pie chart can occur either in or on the chart, and combinations are also possible (percentage in the chart, descriptive text outside).
- Exploded pie charts.
- An angle can be assigned for the axis labeling (e.g. in the case of long texts).
- A horizontal bar chart with labeling directly in the bar.
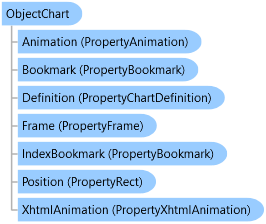
Object Model
Syntax
'DeclarationPublic Class ObjectChart Inherits ObjectBase
public class ObjectChart : ObjectBase
public ref class ObjectChart : public ObjectBase
Inheritance Hierarchy
System.Object
combit.Reporting.Dom.DomItem
combit.Reporting.Dom.ObjectBase
combit.Reporting.Dom.ObjectChart
Requirements
Platforms: Windows 10 (Version 21H2 - 22H2), Windows 11 (22H2 - 25H2), Windows Server 2016 - 2025
.NET: .NET Framework 4.8, .NET 8, .NET 9, .NET 10
See Also