You can output detailed data from a sub-table in a column. For example, if you would like to output all of a client's orders to the right of a client's name, create a column of type "Table", and then output the detailed data.
You can edit the properties of the table object by selecting the table. Double-click to display the familiar table content dialog.
You can also use the action "Attach sub-table" to attach additional tables to this table, e.g. the sum of the various order items.
Please note: If multiple line definitions are defined in the parent table, the option "Keep Lines Together" must be set to "False", as in sub-tables a precalculation of the height is not possible and thus a pagebreak after each data line is triggered.
Figure 5.18: Outputting (sub-)tables to columns
Please note:
1. If multiple line definitions are defined in the parent table, the option "Keep Lines Together" must be set to "False", as in sub-tables a precalculation of the height is not possible and thus a pagebreak after each data line is triggered.
2. If you use counters with totals variables, you must specify the respective table name (e.g.'main table') when defining the totals variables, otherwise the data records of the "subtable" will also be counted. Example: Cond(LL.CurrentContainerItem ="Main Table",1,0)
3. Tables in columns are supported in data rows, group headers and headers. For headers, only static content is supported.
To define it, proceed as follows:
1. Create a new element in the report container and select "Table" as the object type.
2. In the dialog that now appears, select the data source. For an assessment of the sales for each client, select e.g. the table "Customers". Select e.g. "Customer.CompanyName" as the field.
3. In this data row, now add an additional column and output the data of a 1:N-concatenated table. Select "Add/attach new column to table row" (ALT+INS) via the context menu. Alternatively, you may also select an existing column definition and then click on the small down arrow next to this button to determine the type of this column.
4. Select "Table" as column type and then e.g. the column "Orders.OrderID". Although the data row will not be output (because we will be suppressing it), a field is required so that the table will be printed at all.
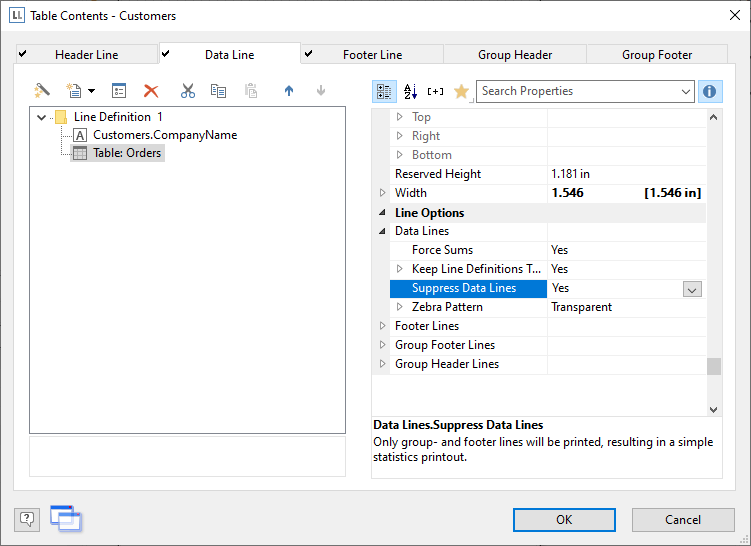
5. Back in the table dialog, select the table "Orders" and set the table property "Data rows > Suppress data rows" to "Yes".
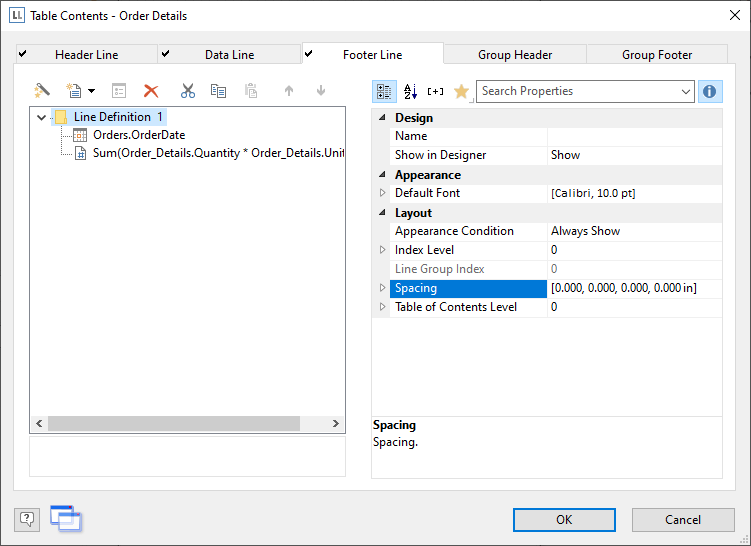
Figure 5.19: Suppressing data rows for a table column
6. Now select "Attach sub-table" via the context menu. Alternatively, you may also select the table and then click on the small down arrow next to this button to attach a sub-table.
7. Select the table "Order Details" as the data source and then the column "Orders.OrderID" once again. Although the data row will also not be output (because we will be suppressing it), a field is required so that the table will be printed at all.
8. Define the sum of the order items as the footer, i.e. in column 1 the order date (Orders.OrderDate) and in column 2, the sum of the sales. You can calculate this by e.g. using the formula "Sum(Order_Details.Quantity * Order_Details.UnitPrice)". These two columns are then output next to the name of the client, as the output of each of the data rows is suppressed.
Figure 5.20: Aggregation in the footer
9. Back in the table dialog, select the table "Order Details" and also set the table property "Data rows > Suppress data rows" here to "Yes".
10. The assessment is complete; i.e. you will now see the orders next to the client name, and next to it the sum of the order items (see Figure 5.18).