There are diverse options for displaying data graphics:
1. A data graphic as an object. Select the "Data Graphic" object and pull it to the right size in the workspace while holding down the left mouse button.
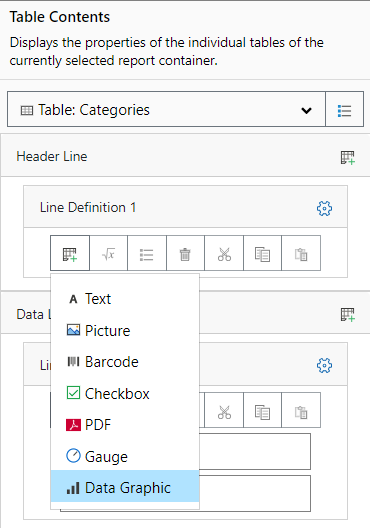
2. You can output a data graphic in a table cell. To do this, select the "Data Graphic" entry from the Table Contents menu object dialog via Add New Column. If you want to output aggregated data, use the output in a footer line.
Figure 4.5: Data graphic in a table column