▪ As with basic templates, enter the name, standard export profile, data source and other properties.
▪ Click on the "Open Ad-hoc designer" button. This launches the Ad-hoc Wizard and analyzes the data source.
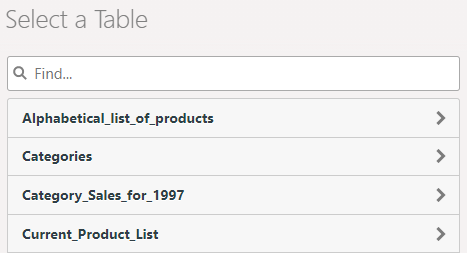
▪ First choose the base table whose data is to be exported.
Figure 2.7: Selecting the base table
▪ First, choose the table columns by clicking "Add Columns".
▪ Click on the plus symbol to select a column. To delete a selected column, click on the minus symbol.
▪ To return to the overview, click on the arrow at the upper left.
▪ You can change the order of the columns by dragging the double arrow symbol.
▪ Click on "Position Columns" to define the column width.
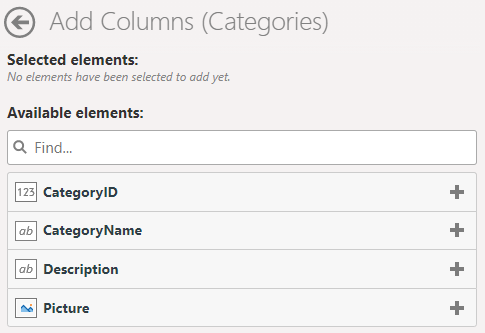
Figure 2.8: Selecting columns
▪ When you click on a column, you can edit the column properties and add a footer:
▪ Specify the title in the header
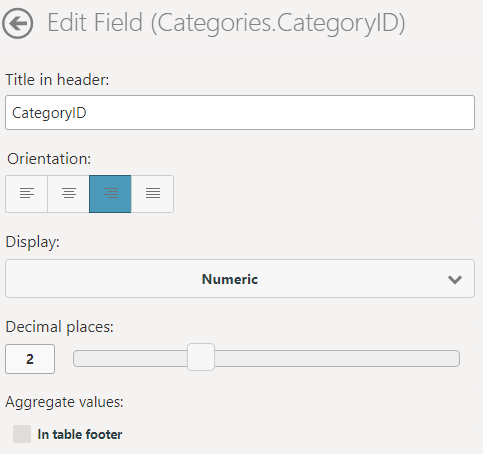
Figure 2.9: Properties of a numeric column
▪ Align left, centered, align right, justified
▪ Display: Numeric (with choice of decimal places), currency (with choice of currency symbol), percent (with choice of decimal places).
▪ Aggregate values:
▪ With numeric columns, you can activate a footer using the "In table footer" option. This calculates the aggregate value for the column as defined in the option box. You can choose from: Average, Count, Maximum, Median, Minimum, Standard Deviation, Sum, Variance.
▪ If the data is to be grouped together for output (see "Sorting and Grouping" below), a group footer can be activated using the "In Group Footer" option. Here, you can also choose from Average, Count, Maximum, Median, Minimum, Standard Deviation, Sum and Variance to aggregate the numerical values.
▪ You can define the appearance of the report in the "Layout" section:
▪ Color scheme: choose a predefined design scheme
▪ Row coloring: Activate zebra pattern
▪ Size: Choose output format
▪ Orientation: Portrait or Landscape
▪ Print Date Position: Do not Show/Use default/Bottom left/bottom centric/Bottom right and the ability to select the date format.
▪ Page numbering position: Do not Show/Use default/Bottom left/bottom centric/Bottom right and the possibility to select the page numbering format.
▪ In the "Sorting and Grouping" section, you can now choose the field according to which the records are to be grouped for display. When you define a grouping, a sorting scheme is automatically created based on this field.
If you do not apply grouping, you can create additional (sub-)sorting schemes or create a sorting scheme.
With grouped data, it is also possible to include group footers (see "Aggregate values" above)
▪ Under "Filters", you specify which columns will be available for filtering during exports.
▪ The selected column is added as a report parameter. For more information, refer to "Report Parameters" in the section "Advanced Functions" in the Designer-Manual.
▪
▪ Click of an entry to configure a filter definition:
▪ Label of input field
▪ For date fields:
▪ Exact date, Define value range (from/to)
▪ Select year/month/quarter
▪ Numerical fields:
▪ Allow no value (NULL)
▪ Input type: Select from existing values (multi selection), Select from existing values (single selection), Manual input, Define value range (from/to)
▪ For character fields:
▪ Allow empty value
▪ Input type: Select from existing values (multi selection), Select from existing values (single selection), Manual input
▪ Save the changes at the top right and start the preview.