▪ As with basic templates, enter the name, standard export profile, data source and other properties.
▪ Click on the "Open Ad-hoc designer" button. This launches the Ad-hoc Wizard and analyzes the data source.
▪ First, choose the table from which data is to be exported.
▪ Click on the arrow at the top right, choose the chart type and then choose a sub-type:
▪ Lines/Symbols: Simple, Consecutively, Stacked, Relative to each other
▪ Areas: Simple, Stacked, Relative to each other
▪ Bars: Simple (also 3D), Tiled (also 3D), Consecutively (3D), Stacked (also 3D), Relative to each other (also 3D)
▪ Circle/Ring: Circle (also 3D), Ring (also 3D)
▪ Radar/Web: Simple, Consecutively, Stacked, Relative to each other
▪ Treemap: Simple, With sub-groups
▪ Funnel: Vertical, Horizontal
▪ General
▪ Specify a title for the chart
▪ Base table: when you change the base table, the diagram is recreated.
▪ Horizontal Axis (X) (Lines/Areas/Bars), Segmentation (Circle/Ring/Funnel), Category assignment (Radar), separation in areas (Treemap):
▪ Lines, areas, bars: Select the column for the x-coordinate.
▪ Circle/Ring/Funnel: Select the column for the segment.
▪ Radar: Select the column for the circle segment.
▪ Treemap: Select the column for the area.
▪ The values can be grouped.
▪ Lines, areas, bars: Labeling of the x-axis
▪ Only Lines simple/Areas Simple/Bars Simple/Treemap: Vertical Axis (Y)
▪ Lines, Areas, Bars: Select the column for the height of the line
▪ Treemap: Select the column for the size of the subarea
▪ Determine whether the number of all values or the number of unique values is to be used.
▪ Labeling Y-Axis
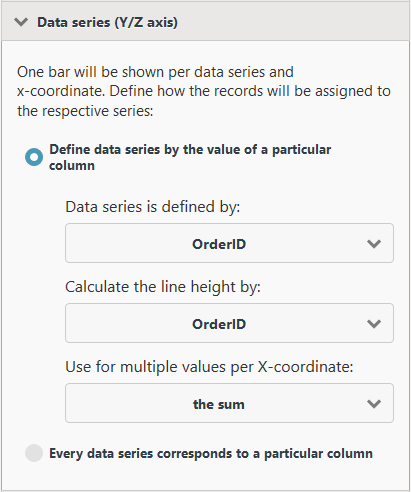
▪ Only Lines, Areas, Bars (each without Simple), Radar: data series (Y/Z-axis)
One bar will be shown per data series and x-coordinate. Define how the records will be assigned to the respective series.
Figure 2.10: Defining data series
▪ Define data series by the value of a particular column:
▪ Specify the column of the data series
▪ Specify the column for the line height of the data series
▪ Specify how multiple values are to be aggregated, e.g., count or sumSpecify the aggregation for the values, such as number or total.
▪ Each data series corresponds to a particular column: To add columns to the data series, click on "Add Columns".
▪ Only Circle/Ring/Funnel: Size of Segments
▪ Select the column for calculating the (relative) segment size.
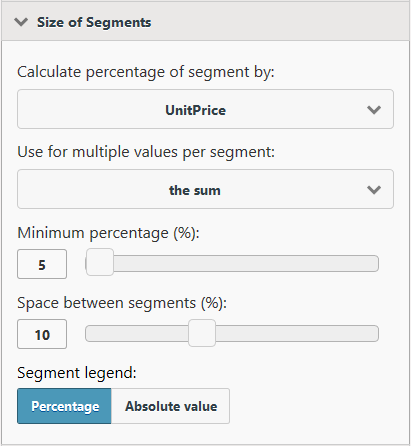
Figure 2.11: Size of segments
▪ Specify how multiple values are to be aggregated, e.g., quantity or sum.
▪ Minimum percentage (%): Especially if you have many values with a small percentage, it might be helpful to combine these in an "Other" segment. You can select a threshold value here at which point the various segments are combined into a larger one.
▪ Space between segments (%): The various segments are clearly delineated. This value is the segment spacing as a percentage of the radius.
▪ Segment legend with percentages or absolute values.
▪ You can change the appearance of the report in the "Layout" section:
▪ Color scheme: choose a predefined design scheme
▪ Size: Choose output format
▪ Orientation: Portrait or Landscape
▪ Only Ring/Circle: Ring/Circle chart type and flat/3D display mode
▪ Only Radar: Display values on axis or at data points
▪ Under "Filters", you specify which columns will be available for filtering during exports.
▪ The selected column is added as a report parameter. For more information, refer to "Report Parameters" in the section "Advanced Functions" in the Designer-Manual.
▪ Click of an entry to configure a filter definition:
▪ Label of input field
▪ For date fields:
▪ Exact date, Define value range (from/to)
▪ Select year/month/quarter
▪ Numerical fields:
▪ Allow no value (NULL)
▪ Input type: Select from existing values (multiple selection), Select from existing values (single selection), Manual input, Define value range (from/to)
▪ For character fields:
▪ Allow empty value
▪ Input type: Select from existing values (multiple selection), Select from existing values (single selection), Manual input
▪ Save the changes at the top right and start the preview.
▪ At the bottom right you can activate the option "Instantly refresh preview when changes are made" via the gear-button. This updates the preview image immediately after changing a setting.
▪ Using the additional option "Limit data volume for faster preview display", you can limit the number of data records that are taken into account for printing the preview. This is particularly useful if the "Instantly refresh preview when changes are made" option is activated. At a limit of 5, for example, only the first 5 categories are considered, the first 5 products for each category, the first 5 orders for each product, and so on.