The report container is the central element of list projects. It allows displaying tabular data (also multi-columnar or nested), statistics and charts as well as cross tables. Data can also be output in different form – e.g. at first for a graphical analysis of the sales by years and then in a detailed tabular list.
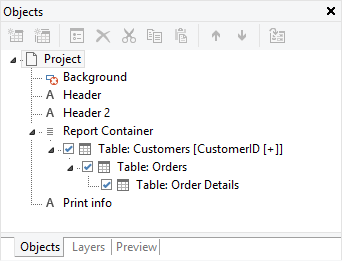
The contents of the container are visible underneath the Report Container object in the "Objects" tool window. Using this window, new content can be added or existing content can be edited. The window is a sort of "screenplay” for the report since the exact order of the single report elements is shown in it.
The Objects tool window in the Designer
To make the report container available, a data provider (see section Data Providers) has to be used as data source. Generally, it is also possible to perform the complete printing on your own by using the low-level API functions of the LlCore object, however this is not the recommended practice since many features (Designer preview, Drilldown, report container, …) would have to be specially supported. If in doubt, it makes more sense to write your own data provider. See section Database Independent Contents.
All provided list samples make use of the report container and therefore provide demonstration material for the different operation purposes.
A detailed description for using this element can be found in the Designer Manual under section "Inserting Report Container”.