
Use the "Report Container" object to add a table to the report. As the name says, a report container can hold several objects: tables, charts and crosstabs can be added in any order.
Note: The report container is not available in all applications. In applications that don't have the report container, use the "Table" object.
1. Choose Insert > Report Container (Objects > Insert > Report Container).
Figure 2.10: Tab "Insert"
2. In the workspace, hold down the left mouse button and pull the object to the required size.
3. A selection dialog will appear for the chosen element type. Choose the "Table" element type.
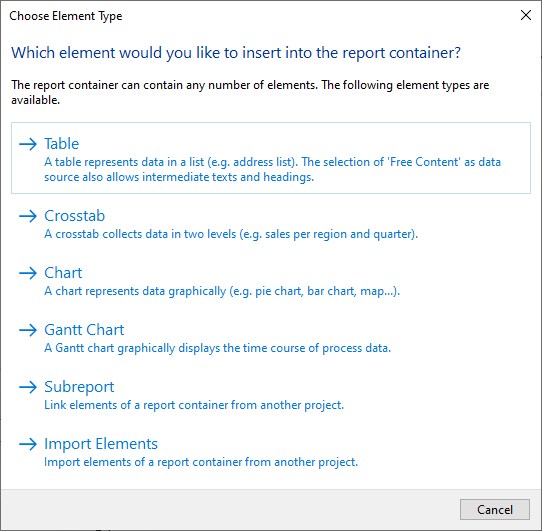
Figure 2.11: Choosing the object type
4. Now supply the data source in the following dialog. All available tables are shown hierarchically; in other words, under the tables, you will find the relational tables in each case.
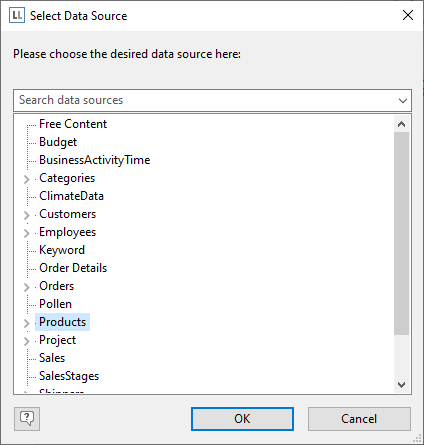
Figure 2.12: Choosing the data source
Select the "Products" table because it contains the fields that we want for our product list.
5. A selection wizard will appear with all the fields in the "Products" table. In addition, underneath the "Products" table, you will also find the fields in the tables "Categories" and "Suppliers" which have a 1:1.relationship with "Products".
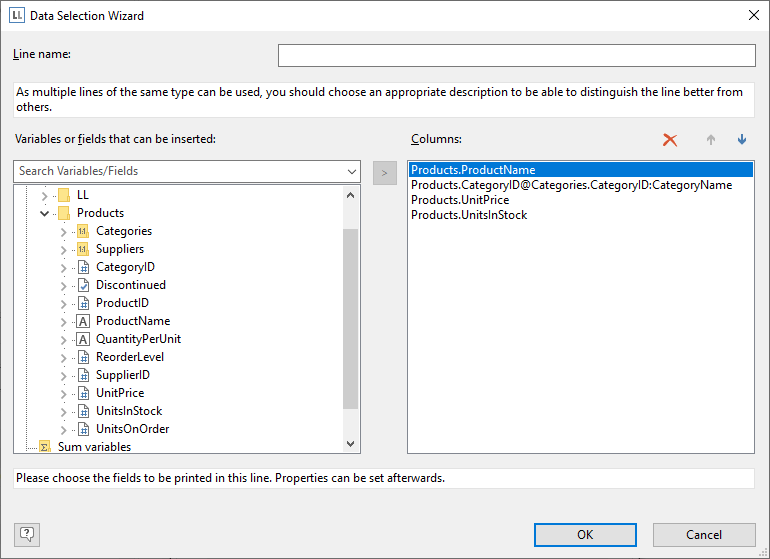
Figure 2.13: Data Selection Wizard
In this dialog, now choose the columns for the table. Double-click a field, e.g. "ProductName". The field will be added to the "Columns" area.
6. Repeat this step for all fields that are to be shown in the table; i.e. also the "CategoryName" field from the linked table "Categories" and the "UnitPrice" field for the unit price. Confirm your selection with OK.
7. The table will now be displayed in the workspace.
▪ The selected fields are displayed in the data line, in other words, the data line contains the data.
▪ In addition, a header line is automatically produced. Header lines are used mostly as column titles, i.e. the selected field names are now shown here as text.
▪ If you pull the report container widthwise to make it wider or narrower while holding down the Ctrl key, the columns will be adjusted proportionally to fit.
▪ The width of the columns adjusts automatically. You can adjust the width of a column manually by moving the separating line to the right or the left with the mouse.
Note: This changes all table columns, whose separators are within +/-2 mm from the mouse position. If you hold down the Ctrl key, the action will only be carried out for the line on which the mouse is positioned. If the option "Change width individually" is enabled (Table> Lines and Columns or Ctrl+M or project option "Column width modification affects next column"), you can alter the column width while making the next column smaller.
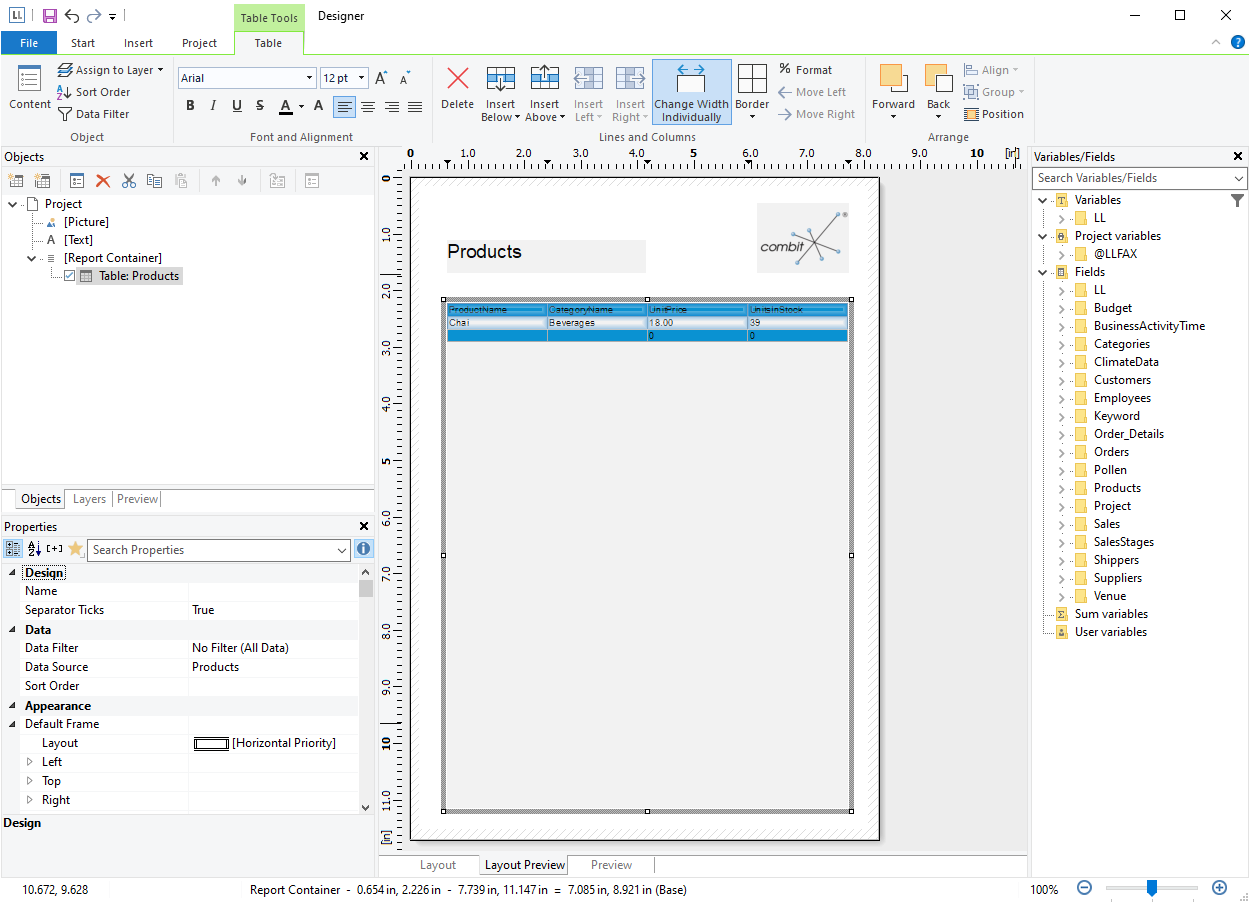
Figure 2.14: Report with table in the report container object