This link type is available for charts, crosstabs and hierarchical tables. The link branches in a report with report parameters. The parameter value has to be provided in the link properties. All data is available in the Drilldown report.
Proceed as follows to create a drilldown report via Report Parameters:
1. Choose Insert > Report Container (Objects > Insert > Report Container). In the workspace, hold down the left mouse button and pull the object to the required size. A selection dialog will appear for the chosen object type. Choose the "Chart" object type.
2. In the following dialog, now select the data source. All available tables are shown hierarchically, in other words, under the tables you will find the related tables in each case.
In the Sample Application, select the "Categories" table.
3. In the object dialog for the chart, now define a simple bar chart:
a. Category Axis (x): the 1:1-field "CategoryName"
b. Value Axis (y): Sum (Order_Details.Quantity * Order_DetailsUnitPrice)
c. Chart: Alignment Left to Right
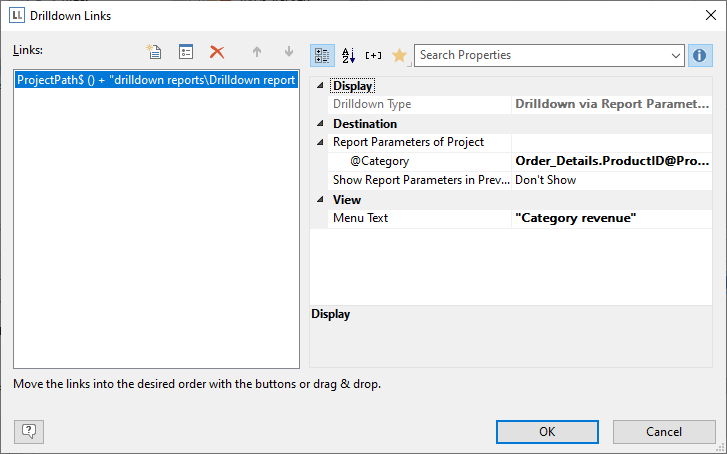
4. Now open the dialog for creating the drilldown link via the "Drilldown Links" property (Value Axis Tab).
Figure 6.74: Drilldown-Report with Report Parameters
5. Create a new drilldown link with the "Insert new link" button in the dialog that appears. A dialog appears where you can create the print template for the drilldown report. Select the "Create a new project" option and enter the name for the print template.
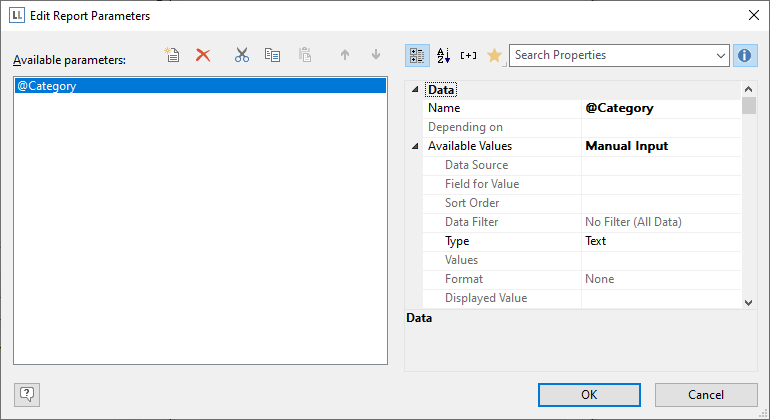
Figure 6.75: Dialog for defining the linked drilldown report
6. A second instance of the Designer opens for you to create the print template. Proceed as usual to create this drilldown report. I.e. you create a report container, choose the "Table" object type, choose "Categories>Products>Order_Details" as the data source and define the columns of the table that are to be shown in the report.
d. Table Categories: A Footer Line with 2 columns: Text "Total" and a sum column "Sum (Order_Details.Quantity * Order_Details.UnitPrice)".
e. Table Products: A Group Footer grouped by "Products.ProductName" with 3 columns: Sum (Order_Details.Quantity), 1:1-field ProductName, Sum (Order_Details.Quantity * Order_Details.UnitPrice).
f. Table Order_Details: A Data Line with any column. In this table, set the property "Suppress Data Lines" to "Yes".
7. Now we create the report parameter to limit the displayed values. Select Project > Report Parameters, click on "Insert a parameter" and name it with a corresponding name, e.g. "Category". All other properties are not relevant for a Drilldown report.
For more information about Report Parameters see chapter Report Parameters.
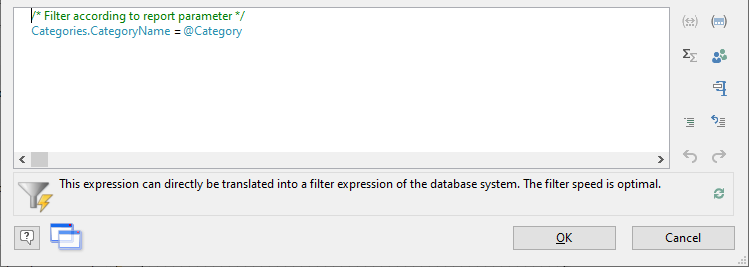
Figure 6.76: Edit Report Parameter
8. Define the corresponding formula for limiting the data in the property "Filter" of the table "Categories". Pay attention to the notes in chapter Filter.
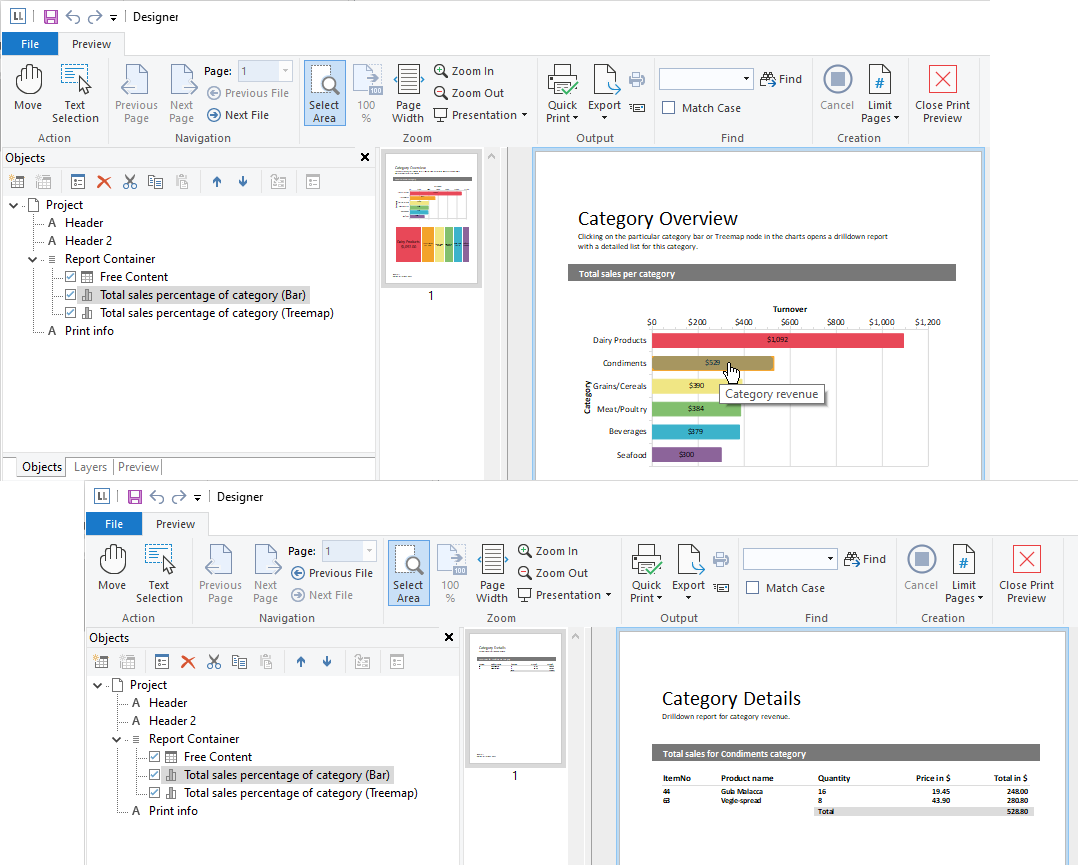
Figure 6.77: Formula for the filter
9. Once you have completed the report, close this second Designer instance.
10. Back in the "Drilldown Links" dialog you now only have to define the report parameter of the project, i.e. we're assigning the corresponding database field "CategoryName" to @Category.
11. In addition, you define the "Menu Text" property for this link. If you have more than one link, its text will be shown in a context menu. If the text is variable (e.g. "List for " + CategoryName) it will also be used as the title for a tab if multiple drilldown reports are shown in a preview window.
Figure 6.78: Report Parameter
12. You have now finished the drilldown report and you can display it in the preview.

Figure 6.79: Drilldown-Report with Report Parameters