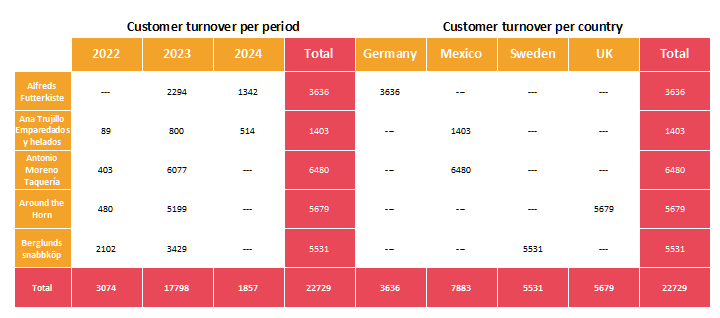
In the column level, several, completely different groupings can be used, which are output one after the other. A simple example would be the grouping of the sales of different products - first over time, e.g. over the years; and then additionally in comparison of the countries or regions:
Figure 6.52: Multiple groupings in one crosstab
Thereby the subtotals can be hidden. In addition, both crosstab parts can also aggregate over different values. The "Data for crosstab" selection list is used to determine which crosstab is processed. By default, only the "Base" is available here.
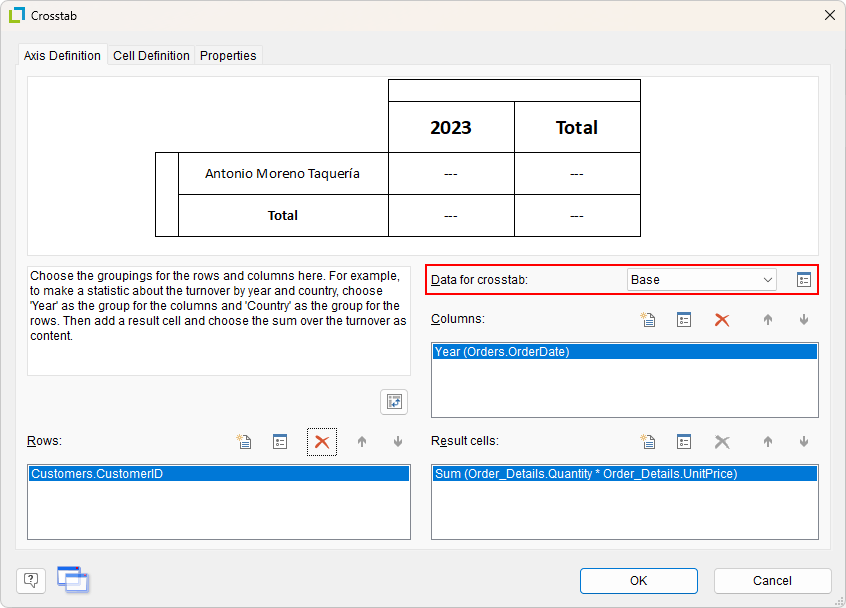
Figure 6.53: Determine grouping
The button behind the selection list can be used to open a dialog that can be used to create additional, linked crosstabs. These can now be edited in the axis definition. For example, to achieve the desired evaluation by country, the corresponding selection is made under "Columns". Please note that the row grouping is the same for all crosstabs - therefore this is only to be edited for the base level.
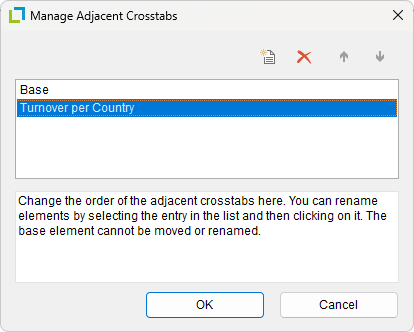
Figure 6.54: Create more groupings