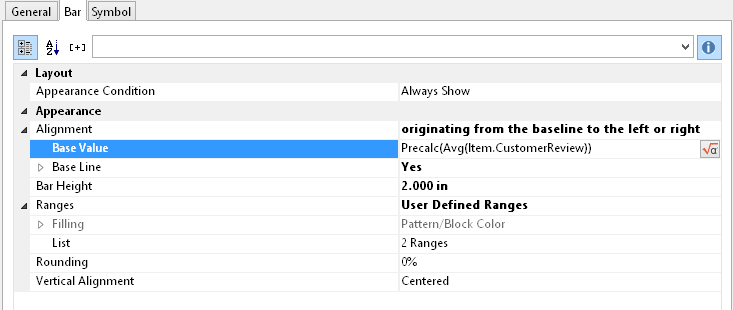
Under the "Bar" tab you can define a bar graphic. You can choose from options such as:
▪ Alignment: If you select "originating from the baseline to the left or the right", a base value can be given, on which the display of the bar to the left or the right will depend. The Precalc()- function could be useful here.
▪ Rounding, Bar Height
▪ Sections: Define various sections in the start and end value in order to assign colors to the partitions.
Please also refer to the chapter titled Overview of Properties.
Figure 6.40: Value of the Data Graphic